
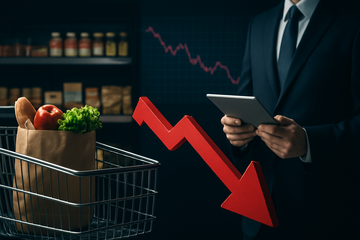
Kroger FY26 identical-sales (ex-fuel) guide cut
0.2%–0.8%
from 1.0%–2.0% (March 5, 2026 guide); ~140bp headwind cited
Kroger Q2 FY26 identical sales (ex-fuel)
+0.2%
vs. +3.4% in Q2 FY25; ~138bp headwind from the Inflation Reduction Act
Kroger Q2 FY26 adjusted EPS
$1.09
vs. $1.04 in Q2 FY25; beat $1.06 consensus
Kroger Q2 FY26 total sales
$34.6B
+2.1% YoY; reaffirmed FY26 adjusted EPS of $5.10–$5.30
Albertsons Q1 FY26 identical sales
−0.8%
FY26 guide cut to (1.5)%–(0.5)% from 0.0%–1.0% on July 23, 2026
Hormel Q3 FY26 retail volume
−9.1%
FY26 net sales guide cut to $12.1B–$12.2B from $12.2B–$12.5B
Walmart Q2 FY27 US comp sales (ex-fuel)
+2.6%
down from +4.6% in Q2 FY26; revenue $187.9B, +5.9% YoY
Walmart US grocery market share (Numerator,2026)
19.9%
down ~10bp from 2024; Costco up ~30bp to ~8.2%
The cut: Kroger just made the trade-down a hard number
The Kroger Co., the $148B U.S. grocer that runs 2,726 supermarkets, told Wall Street on Sept. 11 that it now expects full-year identical sales excluding fuel of just 0.2% to 0.8% — a midpoint of 0.5% that is roughly two-thirds below the 1.5% midpoint the company itself was guiding to as recently as March. The cut came even as the quarter itself was a clean beat: adjusted EPS of $1.09 versus $1.06 consensus and $34.6B in total sales, up 2.1% year over year.
The mechanics tell the real story. Same-store sales ex-fuel decelerated to +0.2% from +3.4% a year ago, and roughly 138 basis points of that gap came from what Kroger called a headwind from the Inflation Reduction Act — a policy-driven step-down in benefits spending that is now showing up as identical-sales math.
The quarterly numbers were carefully constructed to soften the guide cut. Kroger reaffirmed FY26 adjusted FIFO operating profit of $5.0B–$5.2B, adjusted EPS of $5.10–$5.30, and free cash flow of $2.7B–$2.9B. Buybacks remained active — $1.0B in the quarter and $1.2B year-to-date against a $2B authorization — and the board lifted the dividend11% to $0.39 per share, marking20 consecutive years of increases.
New CEO Greg Foran — a Walmart U.S. veteran installed in February 2026 — is using his first six months to lean into the discount playbook. He characterized shoppers as “more deliberate,” with “too many promotional trips and not enough of the full basket,” a phrase that captures the volume problem packaged-food suppliers have been flagging for two quarters.
The pattern: three formal confessions in seven weeks
Kroger is the third major U.S. food company in 49 days to formally lower its forward outlook because consumers are spending less per trip. The cadence — and the corroboration — matters more than any single cut.
First came Albertsons Companies on July 23, when identical sales fell 0.8% and management slashed FY26 identical-sales guidance to (1.5)%–(0.5)% from 0.0%–1.0%, pulled adjusted EBITDA to $3.55B–$3.625B from $3.85B–$3.925B, and cut adjusted EPS to $1.75–$1.85 from $2.22–$2.32. To respond, CEO Susan Morris launched “ACI Edge,” collapsing 11 divisions into four regions and centralizing center-store merchandising, targeting $200M in annualized savings.
Then Hormel Foods on Aug. 27, where retail volume fell 9.1% — net sales of $2.96B dropped 2.4% year over year and full-year guidance was trimmed to $12.1B–$12.2B from $12.2B–$12.5B. The volume number, not the price, is the story: organic sales declined 2% while volume declined 9% in the retail segment, a textbook trade-down signature.
- Albertsons Companies, July 23, 2026: identical sales −0.8%; FY26 identical-sales guide cut to (1.5)%–(0.5)% from 0.0%–1.0%; adjusted EBITDA cut ~$300M at the midpoint; launched ACI Edge restructuring.
- Hormel Foods, Aug. 27, 2026: Q3 net sales −2.4% YoY; retail volume −9.1%; FY26 sales guide cut $100M–$300M; management cited commodity turkey and private-label snack-nut weakness.
- The Kroger Co., Sept. 11, 2026: identical sales (ex-fuel) decelerated to +0.2% from +3.4%; FY26 identical-sales guide cut from 1.0%–2.0% to 0.2%–0.8%; adjusted EPS and free-cash-flow guides both reaffirmed.
Read together, the three numbers describe a single phenomenon moving through the supply chain: lower-income shoppers are stretching benefit dollars across more trips, and what gets cut first is unit count, not price. The 138–140 basis-point headwind Kroger flagged — and the 100bp headwind Albertsons flagged in its Q1 — line up cleanly enough that it is best read as a structural policy effect on SNAP and related transfers rather than a one-quarter wobble.
Supply chain: who pays for the trip-stretching
The transmission runs straight from the grocer checkout to the supplier P&L. When shoppers make more trips with smaller baskets and lean toward private label, shelf-stable CPG companies see volume contract even when headline dollars are flat.
Hormel Foods is the cleanest exhibit. Q3 retail volume fell 9.1% on net sales of $1.78B — a 4.3% dollar decline — driven by commodity turkey and private-label snack nuts. The company nonetheless raised its adjusted EPS guide to $1.45–$1.51, showing that margin management can offset unit weakness for a single quarter; the question is whether the 9.1% volume decline has further to run.
Retail volume vs. net sales — Q3 FY2026
Hormel retail segment shows unit decline outpacing dollar decline — the classic trade-down signature.
Unit: %
Hormel retail net sales YoY
Reported in Q3 FY26 release, Aug. 27, 2026
-4.3
Hormel retail organic sales YoY
Excludes divestiture impact
-3.3
Hormel retail volume YoY
Including turkey and private-label snacks
-9.1
Hormel International net sales YoY
International volume fell 11%
-4.7
The damage is broader than one quarter. Conagra Brands closed FY26 (May 31, 2026) with a Q4 reported operating margin of (57.5)% as the company took an impairment; full-year organic net sales were roughly flat even as reported net sales rose 3.6% — pricing carried the top line while volume did the work. Kraft Heinz booked a $5.46B net loss in Q2 CY2026 (ended June 27, 2026) — EPS of ($4.60) — as it moved ahead with the previously announced split into two companies. General Mills reported a Q4 FY26 net loss of $2.0B (EPS of ($3.74)) on impairments, even though underlying operating income of $690M was solid.
What this list of impairments shows is that mid-sized branded suppliers are now destroying their own book equity to get to a post-trade-down earnings baseline — a step that almost always precedes a volume-led recovery, not a price-led one.
- Conagra Brands Q4 FY26 (May 31, 2026): reported operating margin (57.5)% on goodwill impairment; FY26 organic net sales approximately flat.
- Kraft Heinz Q2 CY2026 (June 27, 2026): net loss of $5.46B / EPS ($4.60) on impairment tied to breakup announcement; TTM revenue $24.9B.
- General Mills Q4 FY26 (May 31, 2026): net loss of $2.0B / EPS ($3.74) on impairment; underlying operating income $690M.
- Campbell Soup FY26 (ended July 31, 2026): quarterly revenue growth (7.9)% YoY, with margin still constrained by snacks mix.
Even Tyson Foods, where Q3 FY26 results held up better than feared, is exposed: roughly half of U.S. protein demand now passes through retail rather than foodservice, and consumer demand for cheaper cuts is reshaping mix. Tyson’s TTM revenue of $55.7B and operating margin of 2.5% leave little buffer if Hormel’s 9.1% volume decline generalizes to the meat case.
Downstream: Walmart and Costco keep taking share
If the trade-down is real, the math should show up as share gains at the discount-format grocers — and it does. Walmart and Costco are the two structural beneficiaries, and their latest quarters confirm the pattern.
Walmart reported Q2 FY2027 (ended July 31, 2026) revenue of $187.9B, up 5.9% year over year, and raised its full-year outlook. Operating income rose 28.8% to $9.38B. U.S. comparable sales ex-fuel were +2.6% — slower than +4.6% a year ago, so even Walmart is feeling the ticket-size pressure — but transactions were +1.5% on top of mid-single-digit U.S. grocery comps. Higher-income households continued to drive the grocery dollars, the company said.
- Walmart Q2 FY27 (Aug. 20, 2026): revenue $187.9B, +5.9% YoY; U.S. comp sales ex-fuel +2.6%; operating income +28.8% to $9.38B; raised full-year outlook.
- Costco Q3 FY26 (ended May 31, 2026): TTM revenue $293.6B with quarterly revenue +21.5% YoY on the membership base; Numerator grocery share up ~30bp to ~8.2% in 2026.
- Numerator 2026 grocery share: Walmart 19.9% (down ~10bp from 2024); Costco ~8.2%; Kroger 6.7% in CPG share (down from 7.2% in 2024); Albertsons 3.6%.
Costco is the cleanest share-gainer in the U.S. grocery market in 2026. Numerator data shows Costco’s grocery share up roughly 30 basis points in two years to ~8.2%, with Kroger sliding to6.7% CPG share from 7.2% and Albertsons holding3.6% but losing unit volume. The gap matters because Costco’s $13.79B EBITDA TTM funds a member-renewal flywheel that lets it absorb price compression; Kroger’s, by contrast, is funded by capital returns — and that is exactly why the dividend hike is the louder signal in this print.
Why now: the mechanism behind the 138–140bp headwind
Kroger and Albertsons used the same phrase in consecutive quarters — a roughly 100–140 basis-point headwind from the Inflation Reduction Act. The IRA in 2022 changed healthcare subsidies and tax credits, but the bigger grocery-relevant effect was a structural step-down in SNAP and related transfer benefits through2025 and into 2026. When benefits fall, low-income shoppers — who make up a disproportionate share of weekly grocery trips — do not stop buying; they buy fewer units per trip and substitute private label and cheaper cuts.
That is exactly the pattern Hormel reported: dollar sales down 2.4% but unit volume down 9.1%. And it is exactly the pattern Kroger reported: shoppers “more deliberate,” with “too many promotional trips.” The mechanism is not mysterious. What is new is that three independent boards have now signed the same memo on the same quarterly cycle.
- The Kroger Co. cited ~138bp IRA headwind to Q2 identical sales and ~140bp to FY26 guide.
- Albertsons Companies cited ~100bp headwind to Q1 identical sales in July 2026.
- Hormel Foods volume −9.1% in Q3 is the unit-level equivalent of the same dollar headwind.
There is a second-order question this raises: how much of the slowdown is the IRA versus a broader K-shaped consumer picture? With Walmart saying it is gaining share “across income cohorts” and Kroger saying it is closing60 stores, the answer is that both are happening — policy is the trigger, but the broader shift in basket composition is a multi-year structural move toward private label, club formats and discount.
Horizons: short-term catalysts and the long-term setup
In days and quarters, the watch list is the next round of retail reads — Costco Q4 FY26 in late September, Tyson Foods Q4 FY26 in November, Mondelez International Q3 in late October — and the next round of supplier prints where volume, not price, will tell the story. Kroger has a clean defensive setup: the dividend hike signals cash-flow confidence, the buyback is running, and operating-profit and free-cash-flow guides are reaffirmed. Albertsons is the cleanest short on the list — same-store sales declining, EBITDA cut ~$300M, dividend payout ratio already stretched.
Over one to three years, the structural call is more important. If the IRA-driven headwind fades, the trade-down remains because Walmart, Costco and Aldi have built durable share-gain machines. If the headwind worsens, branded packaged-food volumes need a new floor — and that is what the Conagra, Kraft Heinz and General Mills impairments are preparing the industry for.
- Days–quarters: watch Costco late September, Kroger Q3 FY26 in December, Albertsons Q2 FY26 in October; track retail-volume lines more than dollar-sales lines.
- 1–3 years: the trade-down extends through private-label gains, club-channel growth and policy effects; volume, not price, will determine branded-supplier returns.
- Milestones to watch: Kroger store closures (60 by year-end), Kraft Heinz split completion, Walmart FY27 guidance updates, CPI food-at-home prints.
Where the trade-down prints on the tape
- Q2 FY27 U.S. grocery comp was mid-single-digit; transactions +1.5% show ticket is the constraint, not the customer — share gains stay durable through the slowdown.
- Operating income rose 28.8% to $9.38B and management raised the FY27 outlook, even as U.S. comp sales ex-fuel slowed to +2.6% from +4.6% — earnings power is decoupling from the top line.
- Risks: a sharper consumer pullback would compress Walmart’s grocery traffic; Numerator share is already ~10bp lighter than 2024, so even the share-taker is not immune.
- FY26 identical-sales guide cut to 0.2%–0.8% from 1.0%–2.0% — the 140bp IRA headwind is now formally in the model and same-store math is decelerating 320bp year-over-year.
- Reaffirmed $5.10–$5.30 adjusted EPS, $5.0B–$5.2B FIFO operating profit and $2.7B–$2.9B free cash flow — earnings power is holding up even as the top line rolls over.
- 11% dividend hike (20th consecutive year) and $1.2B year-to-date buyback against a $2B authorization signal board confidence in the cash-flow bridge; new CEO Foran’s Walmart pedigree is the discount-led counterweight.
- FY26 identical-sales guide cut to (1.5)%–(0.5)% from 0.0%–1.0% — Albertsons is now guiding below zero for the full year while Kroger still guides positive, confirming the second-place grocer is losing share faster.
- Adjusted EBITDA cut ~$300M at the midpoint and adjusted EPS cut to $1.75–$1.85 from $2.22–$2.32; ACI Edge restructuring targets only $200M in annualized savings, leaving a structural gap.
- Dividend payout ratio already at 4.89x TTM earnings — the most exposed payout in the grocery set if identical sales keep missing; shares fell ~20% on the July 23 print.
- Retail volume fell 9.1% on a 4.3% net-sales decline in Q3 — the cleanest signal that shoppers are buying fewer units per trip, not just switching brands.
- FY26 net sales guide cut to $12.1B–$12.2B from $12.2B–$12.5B even as adjusted EPS was raised to $1.45–$1.51, showing margin can mask volume for one quarter but not a full year.
- International segment lost $29M versus a year-ago profit on4.7% sales decline and 11% volume drop — the trade-down is not a U.S.-only story.
- Q4 FY26 (May 31, 2026) reported operating margin of (57.5)% on impairment shows the company is resetting its cost base to a lower-volume reality.
- FY26 organic net sales were approximately flat while reported rose 3.6% — pricing carried dollars but volume was the constraint, a template for branded suppliers through 2026.
- Dividend yield near 9.2% reflects market skepticism on payout sustainability — the trade-down needs to find its floor before the dividend coverage story repairs.
- Q2 CY2026 (June 27, 2026) net loss of $5.46B / EPS ($4.60) on impairment ties the breakup announcement directly to a clean accounting reset for the post-split businesses.
- TTM revenue $24.9B at a 0.8x price-to-book ratio gives split arb optionality, but the underlying volume backdrop is the same trade-down pressure hitting Hormel.
- Risks: split execution risk and the risk that volume never returns to support the dividend, currently yielding ~6.4%.
- Numerator data shows Costco’s grocery share up roughly 30 basis points in two years to ~8.2% in 2026 — the cleanest share-gainer in U.S. grocery alongside Walmart.
- Membership economics ($13.79B TTM EBITDA, 76x interest coverage) let Costco absorb price compression in a way branded suppliers cannot, deepening the trade-down moat.
- Risks: a sharper consumer pullback would slow transactions, but membership renewals are the cushion — Costco’s earnings are stickier than the trade-down narrative.