
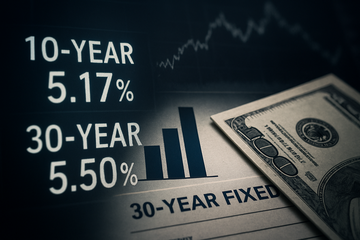
10-year Treasury yield
5.17%
Sep 25, 2026; +99 bps YoY
30-year Treasury yield
5.50%
Sep 24, 2026; highest since June 2004
30-year fixed mortgage rate
7.03%
Freddie Mac PMMS, week of Sep 24, 2026
ACM10-year term premium
0.96%
NY Fed, Sep 18, 2026; well above pre-2022 average
Fed funds target (upper)
4.00%
Raised 25 bps on Sep 16, 2026; first hike since 2023
Federal Reserve Chair Kevin Warsh framed the September rate hike as 'removing accommodation,' not tightening—language that matters because the dot plot now shows 16 of 18 FOMC participants expecting at least one more hike, with four seeing two. Headline PCE was revised up to 3.7% and core to 3.4% for 2026. Yet the prevailing market narrative, recycled through a CNBC interview with Ben Emons of FedWatch Advisors on Sep 25, still treats a 6% 10-year as a 'forecast'—a probability question rather than a curve question. That framing is the trap. The forward Treasury market is already at 6%, term premium is doing most of the lifting, and a Fed pivot is nowhere on the 2027 calendar.
Macro vs. plumbing
Why the 'Fed-Watch' Narrative Is the Wrong Frame
The instinct in any bond rout is to ask where the Fed is going. As of Sep 16, 2026, the answer is up. The Federal Reserve raised the federal funds target range25 bps to 3.75%–4.00% on a 12-0 vote—the first hike since 2023—and the Summary of Economic Projections moved core PCE for 2026 up to 3.4% and headline PCE to 3.7%. Markets now price additional hikes as the base case, not the tail: CME FedWatch showed more than 75% odds of an October move on Sep 24, up from about 49% a week earlier, and Emons puts the cumulative probability of further October and December hikes near 70%. Watching the Fed for relief is watching the wrong instrument.
Curve decomposition
What's Actually in the Curve Today
Decompose the 5.17% 10-year into its two ACM components—expected average short rate over the next decade, and term premium—and you get a picture the headlines skip. The expected path, given a Fed that is hiking in September 2026 with no cuts penciled until 2028, contributes a meaningfully higher real-rate component than markets were running in 2024. The 0.96% term premium is the rest, and it is plumbing: supply, dealer balance sheets, foreign demand, leverage. Emons, in a Sep 24 substack post, notes that leveraged curve trades, basis, relative-value, and swap-spread positions together run about $1.3 trillion—an overhang that magnifies any directional move.
| Tenor | Yield | Recent move | Anchor reference |
|---|---|---|---|
| 2-year | 4.94% | +4 bps on Sep 24 | Highest since 2007 in early Sep |
| 10-year | 5.17% | +99 bps YoY | +4 bps from Sep 24 close at 5.22% |
| 30-year | 5.50% | +10 bps on Sep 24 | Highest since June 2004 |
| 30Y mortgage (Freddie Mac) | 7.03% | +8 bps WoW | Highest in Trump's current term |
10-year term premium has done most of the lifting since 2022
NY Fed ACM model, percent; pre-2022 average was roughly +0.15%, post-2022 norm has been +0.7% to +1.0%
Unit: Percent
Jan 2022
0.1%
Sep 2022
0.3%
Mar 2023
0.4%
Sep 2023
0.7%
Sep 2024
0.6%
Sep 2025
0.8%
Sep 18, 2026
1%
Emons also flags that the technical setup argues for a 6.25% 10-year, not just 6%. The yield broke out of a multi-year wedge at 4.56% in late June, and the wedge geometry—3.40% low (SVB-era 61.8% retracement) to 5.08% high (Oct 23, 2023)—implies an upside target near 4.56% + 168 bps ≈ 6.25%. A Vasicek mean-reversion calibration against the long-run 10-year mean of roughly 7% puts the horizon at about 245 days, or roughly eight months—aligning precisely with the window in which additional Fed hikes could land.
Housing transmission
Housing Has Already Broken at 5%, Not 6%
If the Fed-watch narrative is wrong on the macro side, the housing channel is wrong on the lag. The 10-year is already at 5.17%, the 30-year fixed mortgage is already at 7.03% per the Sep 24 Freddie Mac survey, and intraday prints on Mortgage News Daily touched 7.45% last week. Existing-home sales ran at a 3.98 million SAAR in August—down 1.2% YoY—with pending sales off 4.7% YoY. Mortgage applications to buy a home fell 11% YoY in the latest week, and nearly 10% of borrowers shifted into ARMs to escape the conventional rate. The price side has not capitulated yet because of a severe lock-in effect—sellers with 3% mortgages are not listing—but transaction volume has.
- Existing-home sales: 3.98M SAAR in Aug 2026, -1.2% YoY (NAR, Sep 10)
- Pending home sales: -4.7% YoY in Aug (NAR, Sep 17)
- Mortgage applications to buy: -11% YoY, latest week (MBA, via CNN)
- 30Y fixed: 7.03% Freddie Mac weekly avg, 7.45% intraday MND (Sep 2026)
- Median existing price: $429,100 in Aug, +1.6% YoY—38 straight months of YoY gains
- Variable-rate credit cards tied to prime rate reset higher alongside Fed moves
Equity multiples
The Multiple Squeeze at 5%+, Not 6%
Equity multiples have already started compressing. The S&P 500's forward P/E sat near 19.4x on Sep 22, down from a trailing peak above 25x a year ago, and 23.5x on a trailing basis on Sep 25. The Fed's rate hike has driven the equity risk premium lower in absolute terms even as discount rates have risen—the hallmark of a market being valued for perfection. Forward-return regressions of the S&P 500 against the 10-year yield historically imply low-single-digit annualized returns from current multiples when yields exceed roughly 4.5%.
The plumbing story matters here, too. Banks and broker-dealers carry the largest mark-to-market exposure to duration, which is why the 30-year's 2004-era 5.50% print matters as much as the 10-year's. JPMorgan Chase's investment bank and BlackRock's fixed-income AUM are the two clearest beneficiaries of elevated volatility—trading revenue and active fixed-income flows accelerate when rates move—but the offset is that mortgage origination volumes crater and CRE refinancing windows close.
Supply dynamics
Supply Is the Plumbing Nobody Can Refi
Term premium reflects supply absorption. The Treasury's August long-bond auction cleared at a 5.216% yield—the highest since 2001—with a bid-to-cover ratio of 2.39 and primary dealers taking 11.5% of the issuance, both worse than 12-month averages. Bills dominate the issuance mix: Treasury floated roughly $800 billion of bills in the second half of 2026 alone, with August gross bill issuance at $2.38 trillion. That flood of short-dated paper pushes duration risk onto the long end via the curve, which is exactly what term premium measures. Foreign demand, which historically absorbed30–40% of net issuance, has weakened as hedging costs in yen and euros rise.
| Auction | Yield | Bid-to-cover | Dealer takedown |
|---|---|---|---|
| 30-year, Aug 14, 2026 | 5.216% | 2.39 | 11.5% |
| 10-year, mid-Sep 2026 (avg) | ~5.10% | ~2.50 | ~10% (12-mo avg) |
| 30Y mortgage, Freddie Mac Sep 24 | 7.03% | n/a | n/a |
Horizons
What Moves First vs. What Waits
Short-term (days to quarters), the next catalysts are tightly clustered: October CPI on or about Nov 13, the Oct28–29 FOMC meeting, and the September PCE release on Oct 31. Any of these that prints hot reinforces the Emons 6% path. The Sep 24 30-year print at 5.50% already proves the long end is the marginal mover; further duration stress shows up in mortgage REITs and homebuilder order growth before it shows up in the equity index. Watch the 30-year auction tail on Nov 13 and the MBA mortgage application index weekly—both are real-time thermometers.
Long-term (one to three years), the structural question is whether term premium reverts or persists. A return to the 0–0.3% norm is unlikely without a Fed that is actively buying duration or a buyer-of-last-resort intervention; the structural deficit, foreign-demand erosion, and dealer balance-sheet constraints all argue for a higher equilibrium. The realistic bull case is mean reversion toward the 5.0–5.3% band as growth softens; the bear case is 6.25% on Emons's wedge target if inflation re-accelerates. In either scenario, duration-heavy credit and floating-rate CRE face refinancing walls in 2027–2028 that look materially worse than current spreads imply.
Synthesis
The Trade Is Plumbing, Not Policy
The strongest single finding is that the 'Fed-watch' framing misleads. The Fed is hiking, the dot plot shows more hikes, and CPI prints are running 140 bps above target. Anyone positioned for a 2026 Fed-pivot rally is positioned against the FOMC's own published projections. The 6% 10-year by January is not a contrarian forecast—it is what the forward curve and Emons's wedge geometry independently imply, and it has more to do with a $1.3 trillion leveraged curve overhang and an 0.96% term premium than with the next dot on a FOMC plot.
Stocks most exposed to the 10-year's next leg
- DHI absorbs the brunt of the lock-in freeze: with 30Y mortgages at 7.03% and a 6% 10Y implying ~8% mortgages, mortgage-rate buy-downs compress gross margins and slow order growth.
- Existing-home sales at3.98M SAAR (-1.2% YoY) and pending -4.7% YoY reduce the move-up buyer pool that fuels DHI's upgrade-segment demand.
- Short-term (days–quarters): watch the MBA purchase index and Sept/Oct housing starts for confirmation of a 2027 demand reset.
- Long-term (1–3 years): DHI's land bank and spec inventory give it 18–24 months of cushion, but sustained 7%+ mortgages structurally compress the addressable buyer base.
- Lennar's mortgage finance arm takes a direct hit from application volume collapsing 11% YoY, compounding the homebuilding margin squeeze.
- Spec-home strategy leaves LEN with elevated inventory if rate-driven cancellations accelerate; Emons's 6.25% wedge target threatens a 4Q26 order reset.
- Short-term (days–quarters): Q4 deliveries and cancellation rates are the immediate prints; long-term, mix-shift toward entry-level buyers at lower price points is the only offset.
- PHM is most exposed to the first-time buyer segment, which is the first cohort to be priced out at 7%+ mortgage rates.
- Mortgage rate buy-downs have historically flattened PHM's gross margin by 100–200 bps when rates spike; the current environment is worse than 2024's.
- Short-term: Q3 2026 earnings (late Oct) on incentives and cancellations are the catalyst; long-term, demographic-driven demand is intact but rate-elastic.
- TOL's luxury mix is partially insulated—wealthy buyers are less rate-sensitive—but the move-up segment overlaps with the frozen existing-home market (-1.2% YoY).
- Backlog conversion benefits from prior pre-sale lock-ins, but a 6% 10Y push threatens new-order momentum in coastal markets where affordability is already stretched.
- Short-term (days–quarters): Q4 cancellation disclosures are the swing; long-term (1–3 years), luxury resilience offers a partial hedge against the broader builder sell-off.
- AGNC's agency MBS book is the most direct10-year duration play outside of Treasuries; a 6% 10Y implies meaningful mark-to-market drawdowns on the held portfolio.
- Hedging costs rise as swap spreads widen with $1.3T of leveraged curve positioning; book yield improvements get eaten by hedging drag.
- Short-term (days–quarters): the 30-year Treasury at 5.50% is the proximate stress; long-term, AGNC dividend coverage is at risk if 10Y holds above 5.5% into 2027.
- NLY's larger and more liquid MBS book means mark-to-market moves hit equity value faster than at smaller mREITs; the 30Y at 5.50% is a near-term capital headwind.
- Economic spreads (asset yield minus hedging cost) have compressed as supply swells and term premium widens; book value erosion is the primary risk.
- Short-term: Sep 30 book-value disclosure; long-term, the path back to dividend growth requires a term-premium reset to below 0.5%—not the consensus 2027 outcome.
- Net interest income benefits short-term from the Fed's Sep 25 bps hike and a steeper curve, but mortgage origination revenue suffers from the 7%+ rate environment.
- Investment banking and trading revenue rise with volatility—Emons's wedge target at 6.25% implies sustained rate volatility, which historically lifts FICC revenue.
- Short-term (days–quarters): Q3 earnings on Oct 11 will show the trade-off between NIM expansion and mortgage volume; long-term (1–3 years), JPM is best positioned to gain wallet share in a stressed banking sector.
- Elevated rate volatility and a steepening curve drive active fixed-income AUM and ETF flows; BLK's iShares franchise captures the duration-rebalancing trade.
- BLK's private-credit and infrastructure platforms benefit as bank lending standards tighten, accelerating the shift to non-bank financing.
- Short-term: Q3 AUM disclosure (mid-Oct) confirms flow trends; long-term (1–3 years), the structural shift toward private credit and active fixed-income is the durable tailwind.