
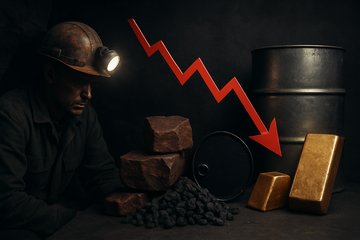
Top 50 miners lost in September 2026
$264B
Ending ranking at $2.26T — second-largest monthly drop in MINING.com's ranking history
Brent crude monthly gain, September 2026
+14%
Biggest monthly advance since July; spot peaked at $132/b on Sept 15
U.S. retail diesel, mid-September 2026
$6.52/gal
Record high, up 67% YoY — a direct hit on haul-truck economics
10-year U.S. Treasury yield, Sept 29, 2026
5.27%
Highest level since 2007; reached 5.35% in early October
Gold miners sector return, Q3 2026
+17.4%
NYSE Arca Gold Miners Index — best-performing S&P 500 sector despite Sept -6.3% bullion
Gold miners sector loss, September 2026
-$79B
-12.7% sector drawdown as gold unwound from August's record
What Actually Just Happened to the World's Top Miners
The world's 50 most valuable mining companies ended September 2026 worth $2.26 trillion, down $264 billion for the month — the second-largest monthly decline in MINING.com's ranking history, behind only the $434 billion wipeout of March 2020. The drop erased roughly three-quarters of the $357 billion the same basket had added in August's record rally, leaving the index 18% below its February peak.
The damage fell unevenly. The fifteen gold producers in the ranking gave up $79 billion collectively (a 12.7% sector drawdown) and not one finished the month higher. BHP absorbed the single largest dollar loss at $26.4 billion after a fatal accident at Escondida on September 23 forced the world's biggest copper mine to suspend operations. Rio Tinto shed $15.8 billion as iron ore stayed below $100 a tonne. Lithium was the worst-performing metal by a country mile: battery-grade lithium carbonate futures in Guangzhou fell 22.5% to 122,800 yuan per tonne — a 39% drop from the May peak — pulling Albemarle and Ganfeng below their 52-week highs and dropping both names out of the Top 50 entirely.
The Causal Chain: Iran, Diesel, Bond Yields, and a $264 Billion Reset
The energy shock that drove this was not subtle. The Iran war, ongoing since February 28, 2026, intensified in September as Iran launched retaliatory strikes on Kuwait, Jordan and Bahrain and the U.S. struck Iranian oil tankers in the Gulf. Brent crude posted a 14% monthly gain — its biggest since July — with the November contract settling at $103.50 a barrel on September 30 and spot prices touching $132 a barrel mid-month. That pushed U.S. retail diesel to a record $6.52 a gallon, up 67% year over year, a direct input into the diesel-heavy haulage fleets that move iron ore, coal and copper concentrate from pit to port.
The second leg of the shock was monetary. As oil-driven inflation expectations rebuilt, the 10-year U.S. Treasury yield hit 5.27% on September 29 — the highest level since 2007 — and stretched to 5.35% within the first week of October. That broke a 20-year-old ceiling and pulled the rug out of gold: bullion fell from $4,441 at the end of August to $4,158 at the end of September (-6.4%), its sharpest monthly drop since the COVID unwind. With the discount rate that prices dividend-paying miners higher spiking and the gold trade unwinding at the same time, the Top 50 ranking lost more than 10% of its market cap in four weeks.
- Iran war → Brent +14% in Sept → diesel at $6.52/gal record (+67% YoY) → bulk-miner cost curves spike
- Oil-led inflation expectations → 10-year Treasury at 5.27% (24-year high) → gold and dividend miners re-priced lower
- Gold -6.4% from $4,441 to $4,158 in one month → gold sector -12.7% → $79B of August gains erased
- Lithium carbonate -22.5% in Sept → Albemarle and Ganfeng exit Top 50 → SQM the only lithium pure-play left at $115/sh
Copper Held. Bulk Didn't. Lithium Broke.
The non-obvious read of this selloff is that high-grade copper producers absorbed the energy shock almost intact, while bulk iron-ore and coal miners took the worst of it. The mechanical reason is simple: copper sells by the pound at a record-high nominal price (LME at $14,366 a tonne on October 5), so a 67% spike in diesel adds a few hundred million dollars of cost against tens of billions of revenue. Iron ore, by contrast, trades in a tight $90-100 band at the bottom of the cycle — every extra dollar of diesel flows straight to the bottom line.
The copper complex is also facing a structural supply squeeze that energy-driven cost pressure only tightens. Freeport-McMoRan reported on October 2 that Grasberg averaged 140,000 metric tons of ore per day in Q3 2026 — roughly 67% of the pre-incident rate — with management guiding to 80% capacity in mid-2027. Freeport-McMoRan expects consolidated Q3 copper sales of around 750 million pounds; the mine has lowered its 2026 production plan four times since the 2025 mudflow. Bank of America responded to the tightening by raising its long-term copper price forecast 20% to $12,000 a tonne and upgrading BHP to Buy with an A$68 price objective — calling it the top pick among large-cap miners precisely because copper, not iron ore, is now BHP's biggest earner.
| Metal / Bucket | Sector move | Dollar impact | Representative names |
|---|---|---|---|
| Gold | -12.7% | -$79B | Newmont, Agnico Eagle, Kinross Gold, AngloGold |
| Copper | -7.6% | -$44B | BHP, Freeport-McMoRan, Teck, First Quantum Minerals |
| Iron ore / bulk | ≈-9% | -$15.8B+ | Rio Tinto, BHP iron-ore book, Fortescue |
| Lithium (pure-plays) | -17% to -32% YTD | Exit Top 50 | Albemarle, Ganfeng, Tianqi; only SQM survives |
Gold's Two-Speed Story: September Stumbles, Q3 Still Wins
Gold's September was brutal on the surface and quietly historic in context. Bullion fell 6.4% — from $4,441 to $4,158 an ounce — driving the fifteen gold miners in the Top 50 to a combined $79 billion drawdown, and Shandong Gold's 27.8% plunge was the worst single-stock move in the ranking after the company cut its 2026 production target from 1.58 million ounces to between 1.16 and 1.22 million. Kinross Gold dropped 21.3% after cutting 2026 and 2027 guidance on winter weather at La Coipa and weak grades at Round Mountain. Gold Fields lost 21% on the month and another leg when its unsolicited A$38.7 billion bid for Northern Star was rejected on September 28 — Northern Star ended the month down only 3.1%, the best of any major gold producer, cushioned by the bid premium.
But zoom out and the September pullback is noise inside a much bigger uptrend. The NYSE Arca Gold Miners Index returned 17.4% in Q3 2026, beating every single S&P 500 sector including energy's 17.2% rally. Central banks and ETF investors kept buying through the rate spike. Gold has already reclaimed the $4,100 level in early October, with the spot quote around $4,158 and the psychological support tested but intact. The cleanest read: the energy and bond shock forced a tactical unwind of the gold trade, but the secular driver — central-bank diversification and falling real yields longer-term — has not been broken.
Q3 2026 sector total returns
NYSE Arca Gold Miners Index vs. S&P 500 sectors, three months ended Sept 30, 2026
Unit: %
Gold Miners
Best of all S&P sectors
17.4%
Energy
Oil-driven, second-best
17.2%
S&P 500
Broad market total return
2.3%
What to Watch Next: Three Catalysts That Move the Mining Tape
- Escondida restart timing. BHP's $26.4B September loss hinges on when Chile's Sernageomin lifts the suspension at the world's biggest copper mine; a supervisors' union strike vote on the latest contract offer adds a second leg of supply risk.
- 10-year Treasury yields. A move above 5.35% would force a second leg of gold-miner de-rating; a drop back toward 4.75% would reopen the gold trade and likely drag the iron-ore bulk miners back up with it.
- Iran negotiations and Brent. A peace deal would crush diesel, reopen cost curves for bulk miners, and remove the inflation impulse from the bond market — the cleanest scenario for a broad mining rally.
Over a one- to three-year horizon the structural thesis is unchanged: copper is heading into a multi-year deficit as Grasberg, Cobre Panama (still shuttered, contributing 1.5% of global supply before its 2023 closure) and ageing Chilean ore grades tighten the supply curve against AI-driven and electrification-driven demand growth. Goldman Sachs projects a 1.5 Mt annual copper deficit by 2026 widening into 2030; the IEA sees global copper demand rising from 26.7 Mt in 2024 to 31.3 Mt by 2030 under current policies. The energy shock is a cyclical interruption, not a structural break — and it's drawing capital into the highest-quality copper producers precisely because their cost curves are the most resilient.
How to Position
- Grasberg returning to 67% of pre-incident throughput lifts 2027 copper sales toward the 1.2-billion-pound recovery target
- Q3 2026 expected copper sales of ~750M lbs cushion the energy shock even as diesel doubles versus 2025
- BofA's 20% copper price upgrade to $12,000/t underwrites FCX's forward 18x P/E and $74 consensus target
- Moved into the No. 2 spot in the global mining ranking at $171B with only a 3% September drawdown — the cleanest read in the basket
- Pure-play copper exposure with a 62% gross margin and net debt/EBITDA of 0.29x gives maximum insulation from energy-cost spikes
- Q3 earnings growth of +71.6% YoY already reflects the record copper price filtering through to bottom-line leverage
- BofA upgraded BHP to Buy with an A$68 price objective on the same note as the $12,000/t copper forecast, calling it the top pick among large-cap miners
- Largest single-stock loss in the September ranking ($26.4B, -11%) on the Escondida suspension, but copper now overtook iron ore as its biggest earner in the FY2026 results
- Forward P/E of 17.2x against a $77.58 consensus target leaves room for re-rating if Escondida restarts cleanly and Brent holds above $100
- Iron ore stuck below $100/t — $91.35 on Oct 2 — hits the segment that is still 60%+ of group revenue and crushes margins when diesel runs at $6.50/gal
- September -8.9% (-$15.8B) shows how directly bulk-miner equity tracks diesel; UBS's $93 long-term iron-ore forecast offers little cover
- The Copper and Aluminium & lithium segments are the only offsets; meaningful re-rating requires either a Brent pullback or a copper squeeze into 2027
- NYSE Arca Gold Miners returned 17.4% in Q3 2026 — Newmont is the largest U.S. gold miner with $122B market cap and 14.6x trailing P/E
- Took double-digit billion-dollar damage in the September gold unwind; near-term re-rating hinges on whether gold holds $4,100 support
- Long-term thesis (central-bank buying, falling real yields) intact — buyable on weakness if 10Y Treasury rolls back under 5%
- Dropped out of the Top 50 ranking in September after losing more than a fifth of its value; trades at less than half its 52-week high
- Forward P/E of 11.4x against a $169.81 consensus target prices in a recovery that depends on lithium carbonate holding above the 122,800 yuan/t September low
- Watch the next two Chinese stockpile prints — a sustained drawdown from the 175,000-tonne reported level would be the first hard signal that the lithium bear is ending
- Down 21% in September and another leg lower when Northern Star rejected the A$38.7B (~$27.1B) bid on Sept 28 — but trades at just 7.3x trailing P/E
- If Gold Fields doubles down and lifts the bid to closer to A$45B, GFI becomes a free option on a deal that would create the world's second-largest gold producer
- Watch the next ASX takeover disclosure — a hostile escalation or revised offer is the single biggest near-term catalyst for the stock