
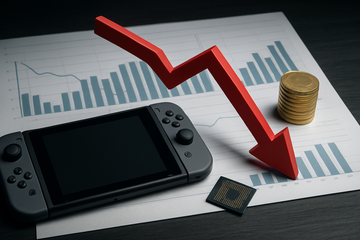
Nintendo has always run a console cycle where the box is the loss leader and software is the profit. What changed in 2026 is that the loss leader got expensive enough to start setting how many boxes it sells. The September quarter is the first clean measurement of that: hardware units fell 41% while software shipments rose 18.8%.
Nintendo fiscal second quarter, ended September 30, 2026
The Console Cycle Just Broke on Memory Costs
Nintendo shipped 2.67 million Switch 2 consoles in the three months to September 30, 2026, fell 41% to 2.67 million units year over year and below the 3.82 million shipped in the June quarter. The company had raised the console's price in every major market first, and its own fiscal 2027 forecast now carries roughly ¥100 billion of higher component costs, mostly memory, inside cost of sales.
Switch 2 sell-in, September quarter
2.67M units
down 41% year over year; fiscal Q2 2027, reported Nov 5, 2026
First-half net sales
¥966.0B
down 12.1% year over year
First-half operating profit
¥216.5B
up 49.1% year over year
Component cost in the FY2027 forecast
¥100.0B
memory and tariffs, booked in cost of sales
Full-year Switch 2 target
16.50M units
left unchanged from the May 8, 2026 forecast
| Market | Old MSRP | New MSRP | Change | Effective |
|---|---|---|---|---|
| Japan (Japanese-language system) | ¥49,980 | ¥59,980 | +¥10,000 (+20.0%) | May 25, 2026 |
| United States | $449.99 | $499.99 | +$50 (+11.1%) | Sep 1, 2026 |
| Europe | €469.99 | €499.99 | +€30 (+6.4%) | Sep 1, 2026 |
| Canada | C$629.99 | C$679.99 | +C$50 (+7.9%) | Sep 1, 2026 |
Volume broke; revenue did not. Quarterly net sales fell 15% to ¥448.2 billion, roughly one-third of the unit decline, because the price increase carried part of the load and because 26.35 million installed consoles keep converting into software. Nintendo lost boxes, not money — the distinction that makes this the cleanest elasticity case in consumer hardware.
The arithmetic inside the guidance
The Forecast Nintendo Left Alone Now Requires a 5.5% Second-Half Rebound
Guidance is where this gets uncomfortable. Nintendo left its full-year forecast exactly as it stood on May 8: net sales of ¥2,050.0 billion, operating profit of ¥370.0 billion and 16.50 million Switch 2 units. With 6.49 million units sold in the first half, the target now requires 10.01 million units in the second half, 5.5% more than the 9.49 million shipped in the same half of fiscal 2026.
Switch 2 sell-in by quarter (millions of units)
Fiscal 2026 quarters derived from Nintendo's disclosed half-year, third-quarter and full-year cumulative figures; fiscal 2027 quarters as reported on Nov 5, 2026.
Unit: millions of units
FY26 Q1 (launch)
launched Jun 5, 2025
5.8
FY26 Q2
4.5
FY26 Q3
holiday quarter
7
FY26 Q4
2.5
FY27 Q1
-34.4% YoY
3.8
FY27 Q2
-41% YoY
2.7
| Line | Fiscal 2026 actual | Fiscal 2027 reported | Implied by the unchanged target |
|---|---|---|---|
| Switch 2 sell-in, full year | 19.86M units | 6.49M in the first half, -37.4% | 16.50M units, -16.9% |
| Second-half sell-in | 9.49M units | not yet reported | 10.01M units, +5.5% YoY |
| Net sales | ¥2,313.0B | ¥966.0B in the first half, -12.1% | ¥2,050.0B, -11.4% |
| Operating profit | ¥360.1B | ¥216.5B in the first half, +49.1% | ¥370.0B, +2.8% |
| Component cost in cost of sales | not disclosed for FY2026 | rising memory and tariff costs | ¥100.0B assumed |
- The December quarter is the first full period at $499.99 in the US and €499.99 in Europe, with the Japanese increase already in force since May 25.
- The Legend of Zelda: Ocarina of Time remake is the only large holiday title positioned to offset a $50 price step.
- Nintendo's February 2027 third-quarter report is the date the unchanged 16.50 million-unit target is most likely to be cut.
- A third consecutive quarterly decline above 30% would make the target arithmetically unreachable without an extraordinary holiday quarter.
Where the profit came from
Profit Survived the Unit Collapse Because Software Now Carries the Box
Nintendo's first-half operating profit rose 49.1% to ¥216.5 billion while net sales fell 12.1%. Divide the profit by the consoles shipped and the economics invert: operating profit per Switch 2 unit more than doubled to ¥33,400 from ¥14,000 a year earlier. The hardware got more expensive to build and to buy; the software on it got far more profitable.
| Measure | Sep quarter FY27 | Sep quarter FY26 | First half FY27 | First half FY26 |
|---|---|---|---|---|
| Net sales | ¥448.2B | ¥527.2B | ¥966.0B | ¥1,099.6B |
| Operating profit | ¥73.9B | ¥88.3B | ¥216.5B | ¥145.2B |
| Operating margin | 16.5% | 16.7% | 22.4% | 13.2% |
| Switch 2 sell-in units | 2.67M | 4.53M | 6.49M | 10.37M |
| Operating profit per Switch 2 unit | ¥27,700 | ¥19,500 | ¥33,400 | ¥14,000 |
The software leg did the heavy lifting: Switch 2 software shipments rose 18.8% to 24.49 million units in the first half while hardware units fell 37.4%, lifting software sold per console from 1.99 to 3.77. Digital sales reached ¥249.6 billion, up 60.5%, and the installed base now stands at 26.35 million consoles carrying 73.21 million software units. A weak software slate would have turned this into a profit collapse — it did not.
Nintendo operating profit per Switch 2 unit (thousand yen)
Derived from disclosed operating profit and Switch 2 sell-in units; the fiscal 2027 bar uses the unchanged full-year forecast.
Unit: thousand yen per console
FY26 first half
14
FY26 full year
18.1
FY27 first half
33.4
FY27 forecast
22.4
Upstream: who collected the money
The Memory Suppliers Turned Nintendo's Cost Line Into Record Profit
Nintendo's ¥100 billion component line is somebody else's record quarter. Micron Technology reported fiscal fourth-quarter revenue of $54.23 billion against $11.32 billion a year earlier, with DRAM revenue of $39.8 billion and NAND of $14.1 billion. SK hynix posted third-quarter revenue of KRW 104.6 trillion at an 80% operating margin, and Samsung Electronics reported third-quarter operating profit of KRW 107.4 trillion, up 783% year over year.
| Company | Latest quarter | Revenue | Profit | Price signal |
|---|---|---|---|---|
| Micron Technology | FQ4 2026, ended Sep 3, 2026 | $54.23B | GAAP net income $37.70B | DRAM revenue +343% YoY, NAND +526%; prices up about 30% sequentially |
| SK hynix | Q3 2026, ended Sep 2026 | KRW 104.6T | Operating profit KRW 83.3T | DRAM ASPs up in the high-20% range sequentially, NAND in the mid-20% range |
| Samsung Electronics | Q3 2026, ended Sep 30, 2026 | KRW 195.3T | Operating profit KRW 107.4T | Device Solutions division operating profit KRW 106.5T |
| Kioxia Holdings | Q2 FY2026, ended Sep 2026 | ¥2,480.0B | Operating profit ¥1,988.3B | October–December revenue guided up just 0.8% sequentially |
The mechanism is allocation, not luck. SK hynix expects the supply-demand imbalance to persist through 2030 because leading-edge capacity takes years to build, and it is shifting lines toward HBM4 and server products. That is what a console maker competes with: the same wafer capacity, priced by data-centre demand, with mobile and console memory left as the residual. TrendForce expects conventional DRAM contract prices to rise 10–15% sequentially in the December quarter and NAND 15–20%.
- Nintendo's ¥100 billion component assumption equals 27.8% of the ¥360.1 billion of operating profit it earned in fiscal 2026.
- The console's 12GB of LPDDR5X and 256GB of UFS NAND sit in the exact product classes whose contract prices have risen, and reporting put the module cost about 41% above pre-shortage levels.
- Micron Technology and SK hynix are selling into a market whose marginal buyer is a data centre rather than a games console, which is why pricing power sits upstream of Nintendo entirely.
Downstream: who absorbed the price
The Elasticity Ladder: Consoles Break, PCs Get Cheaper, Phones Shrink
The same memory bill lands differently depending on what the buyer can defer. A $500 console is the most deferrable purchase in the chain, and it broke. Sony Group raised the US PlayStation 5 to $649.99 on April 2, 2026 on memory costs, then walked most of that increase back to $549.99 by August 21 — a competitor confirming the same elasticity in real time.
| Company or market | Memory-price action | Unit outcome | Revenue outcome |
|---|---|---|---|
| Nintendo (Switch 2) | MSRP +11.1% US, +20.0% Japan | Units -41% YoY in the September quarter | Net sales -15% YoY |
| Sony Group (PlayStation 5) | US MSRP to $649.99, then back to $549.99 | PS5 sell-in -46% YoY in the March 2026 quarter | Game & Network Services sales +8.7% YoY in the September quarter |
| Apple (iPhone) | Price increases across the iPhone line | Record September-quarter iPhone revenue | Revenue $114.5B, +12% YoY |
| HP Inc. (PCs) | Memory and storage costs rising in the bill of materials | PC unit shipments -16% | Revenue +12.5% to $15.7B |
| Lenovo Group (PCs) | Price increases to offset memory costs | Shipment pressure flagged by management | First-quarter revenue $26.9B, +43% YoY |
| Smartphone market | DRAM and NAND contract prices up 10–20% sequentially | Shipments -20% YoY in 3Q26; 2026 forecast -16.7% | 2026 average selling price forecast +27.6% to $581 |
The pattern repeats: every company that raised price kept revenue and lost units, and every lost unit was replaced by a higher average selling price. Apple's September quarter is the proof that the squeeze is survivable when buyers trade up rather than out — $114.5 billion of revenue, up 12%, and a record September for iPhone — but even Apple guided December-quarter gross margin down to 45–46%, with most of the sequential decline attributed to memory. Worldwide PC shipments fell 4% year over year to 65 million units in the June quarter.
- Apple absorbs the bill in margin rather than in units; the guide to 45–46% gross margin is the cleanest measure of the memory cost in a scaled assembler.
- HP Inc. is the mirror image, with revenue up 12.5% while PC units fell 16%, so the bill shows up in mix and margin rather than in the top line.
- Lenovo Group shows the same trade from the other side, growing revenue 43% on AI PC demand while flagging shipment pressure and planning up to $200 million of cost cuts over three years.
- Global smartphone shipments fell 20% in 3Q26, the worst third quarter in 14 years, as2026 average selling prices are forecast to rise 27.6% to $581.
Horizons: days to quarters, and one to three years
Two Horizons: What Breaks Next Quarter, and What the Memory Cycle Already Won
Over the next three quarters the swing factor is supply, not software. The December quarter is Nintendo's first full period at the new US and European prices, 4Q26 contract prices set the cost floor Nintendo plans against, and February 2027 is when the 16.50 million-unit target gets confirmed or cut. Nobody has to believe in the software slate to reach that date — the arithmetic does the work.
- Short term: a December-quarter unit decline above 30% would put the 16.50 million-unit target beyond reach and force a guidance cut in February.
- Short term: the Ocarina of Time remake is the only holiday release large enough to absorb a $50 price step.
- Short term: December contract prints decide whether the ¥100 billion component assumption holds, with NAND already decelerating and DRAM still rising.
- Long term: SK hynix expects the imbalance to run to 2030, so consumer-grade memory floors stay elevated through the next console cycle.
Over one to three years the question changes from elasticity to architecture. Capacity is migrating to HBM4 and server parts, which keeps the consumer memory floor high and the console price floor with it. For Nintendo, that means a structurally higher price, a longer payback period on every console, and a business that has to earn its margin on software rather than on the box. If it can hold ¥370 billion of operating profit on 16.5 million consoles, the memory cycle has changed what a console cycle is worth, not merely how many units it ships.
What the price already discounts
The Market Has Already Rotated From Assemblers to Memory
Nintendo closed at ¥8,289 on November 5, 2026, 43% below its 52-week high of ¥14,630, on 21.7 times trailing earnings with net cash and a 2.5% dividend yield. The memory complex trades at a fraction of that: SK hynix at 3.9 times trailing enterprise value to EBITDA with a 20.4% earnings yield, Samsung Electronics at 3.5 times, Micron Technology at 8.0 times on a 92% return on equity.
| Company | Trailing EV/EBITDA | Trailing earnings yield | Return on equity |
|---|---|---|---|
| Nintendo | 14.5x | 4.6% | 16.3% |
| Sony Group | 8.2x | not meaningful | -2.7% |
| Micron Technology | 8.0x | 9.5% | 91.8% |
| SK hynix | 3.9x | 20.4% | 117.0% |
| Samsung Electronics | 3.5x | 15.9% | 45.7% |
| Kioxia Holdings | 3.3x | 17.9% | 139.7% |
| Lenovo Group | 5.7x | 2.7% | 11.3% |
| Apple | 29.8x | 2.6% | 127.6% |
That dispersion is the investable expression of the thesis. Memory suppliers are being paid for scarcity; assemblers are being asked to absorb it, and the market has already made its choice about who deserves a premium. Nintendo's own numbers are the argument in miniature: revenue guided11.4% lower, operating profit guided 2.8% higher. The company that lost a third of its console volume and still grew profit is now valued at a scarcity-asset multiple while the sellers of the scarce input trade at 3 to 4 times earnings.
The investable map of this cycle
- Hardware guidance of 16.50 million units needs a 5.5% second-half rebound after a 37.4% first-half decline, and is the line most exposed to a February cut.
- Software carried first-half operating profit up 49.1% to ¥216.5 billion on a 26.35 million-console installed base selling 3.77 software units per console.
- Short term: a third straight quarterly decline above 30% makes the target unreachable; long term, ¥370 billion of operating profit must come from software, not hardware.
- At 21.7 times trailing earnings with net cash, the hardware cycle is already discounted — the risk sits in the software annuity, not the box.
- Record DRAM revenue of $39.8 billion inside $54.23 billion of quarterly revenue underwrites another quarter of price gains.
- TrendForce expects conventional DRAM contract prices up 10–15% sequentially in the December quarter, with mobile DRAM still firm.
- Short term: consumer NAND is the soft spot; long term, new capacity targets HBM4 and server parts, keeping commodity DRAM tight.
- 8.0 times trailing enterprise value to EBITDA on a 92% return on equity leaves the scarcity premium underpriced.
- Third-quarter revenue of KRW 104.6 trillion at an 80% operating margin proves this is a pricing cycle, not a volume cycle.
- Management expects the supply-demand imbalance to persist through 2030 as capacity shifts to HBM4 and server products.
- Short term: DRAM average selling prices rose in the high-20% range sequentially; long term, server allocation squeezes the residual consumer supply.
- 3.9 times trailing enterprise value to EBITDA and a 20.4% earnings yield price the cycle as though it ends soon.
- Third-quarter operating profit of KRW 107.4 trillion, up 783% year over year, shows the memory recovery outweighing its own handset and PC exposure.
- The Device Solutions division produced KRW 106.5 trillion of operating profit, nearly the entire group result.
- Short term: memory profit funds buybacks and dividends; long term, capital shifts to HBM4 and advanced packaging.
- 3.5 times trailing enterprise value to EBITDA on a 15.9% earnings yield is the cheapest large-cap route into the same cycle.
- October–December revenue guided up just 0.8% sequentially signals that NAND price growth has stalled.
- Shares fell 13% on November 4 after the December-quarter profit guide missed market expectations.
- Short term: a December NAND contract print below the 15–20% sequential path compounds the derating; long term, over $31 billion of Japanese capacity caps pricing.
- Kioxia is where the memory trade can break first, and it breaks before DRAM does.
- December-quarter gross margin guidance of 45–46% prices the memory bill directly into Apple's margin.
- Record September-quarter revenue of $114.5 billion, up 12%, shows buyers trading up rather than out of the category.
- Short term: another memory-driven guide-down; long term, a 128% return on equity and record services growth cushion the hardware cost.
- At 29.8 times trailing enterprise value to EBITDA, the market expects pass-through to keep working without hurting volume.
- Sony raised the US PlayStation 5 to $649.99 on memory costs then cut it back to $549.99 four months later — the clearest evidence console elasticity is real.
- PS5 sell-in fell 46% year over year in the March 2026 quarter, and Sony says it offset memory prices through promotional adjustments.
- Short term: promotional intensity compresses game-segment margin; long term, network services carry profit while hardware units shrink.
- Group net income rose 44% to ¥449.6 billion in the September quarter, so this is an argument about hardware, not about Sony's earnings.
- First-quarter revenue of $26.9 billion, up 43%, shows a PC maker growing through the memory crunch on AI mix and pricing.
- Management has flagged PC shipment pressure from memory costs and plans up to $200 million of cost cuts over three years.
- Short term: units are the binding constraint; long term, 5.7 times trailing enterprise value to EBITDA reflects an assembler paying for scarcity.
- Lenovo is the cleanest Hong Kong expression of the trade: price up, units capped, mix carrying the result.