
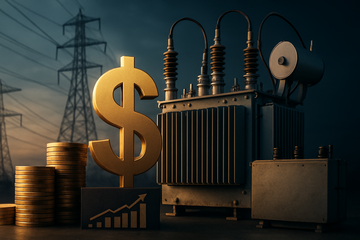
China is on course to spend $945 billion on energy in 2026, against $615 billion for the United States and $3.4 trillion for the world. That is one country funding 28% of global energy capital formation, and China spends 1.5 times more on energy than the United States. The headline number hides the part that matters for investors: China is rotating its spending out of power plants and into the grid that carries them, and it is rotating into the one category of hardware the West is short of.
China energy investment, 2026
$945B
IEA World Energy Investment 2026 estimate; widely reported as ~$940B in Nov 2026 coverage
US energy investment, 2026
$615B
IEA World Energy Investment 2026 estimate, against $440B for the European Union
China grid investment, 2026
~$140B
Roughly a quarter of the ~$550B the world spends on electricity networks in 2026
US power transformer shortage, 2026
15%
Wood Mackenzie, Aug 31, 2026; substations short 8%
PJM capacity price, 2028/29 auction
$325/MW-day
Cleared at the administrative cap, Jul 14, 2026; 2024/25 was $28.92
US import price of Chinese electrical gear
-6% vs 2012
BLS import price index, Sep 2026 (93.8, Jun 2012 = 100), still sliding
The IEA ledger
One Country Now Funds 28% of the World's Energy Build
The International Energy Agency's World Energy Investment 2026 puts global energy capital formation at $3.4 trillion, a 5% rise on 2025. China leads at $945 billion, ahead of the United States at $615 billion and the European Union at $440 billion; clean energy takes $2.2 trillion of the total, and China, the US and the EU together account for $1.5 trillion, or 66%, of it. China extended a lead it first took in the 2025 edition, when it edged ahead of the United States as the largest national energy investor.
2026 energy investment by region
IEA estimates. Global energy investment totals $3.4 trillion in 2026, of which China alone accounts for 28% and the US 18%.
Unit: USD billion
China
Largest investor; up roughly 5% on 2025
945
United States
Power generation investment rises nearly 10% to $140B
615
European Union
Third largest; combined with China and the US, $1.5T of clean energy
440
Here is the part the headline misses. China's low-emissions power investment falls from about $315 billion in 2025 to under $290 billion in 2026 — the country is cutting generation capex while grid capex rises to roughly $140 billion. Beijing is spending less on making electrons and more on moving them, and it is doing so through the same procurement machine that supplies the rest of the world. That is why Chinese electrical equipment is the marginal supply in every grid market on earth, including the American one.
| 2026 estimate | China | United States |
|---|---|---|
| Total energy investment | $945B | $615B |
| Share of global total | 28% | 18% |
| Grid investment | ~$140B | Not disclosed separately |
| Power generation investment | <$290B low-emissions, down from ~$315B | ~$140B, up nearly 10% |
| Battery energy storage | Included in grid and clean-energy spend | $26B |
- China now runs 2.337 billion kW of installed renewables, supplying 38.3% of its electricity from a base that is 60.1% of national capacity.
- Renewables took 63.6% of all new renewable installations worldwide in 2025, and the IEA expects emerging economies outside China to add about 1,100 GW by 2031, roughly matching advanced economies for the first time.
- Coal-fired generation fell to 49.7% of the power mix in the first half of 2026, breaking below half for the first time.
- State Grid plans to invest 4 trillion yuan through 2030, 40% more than the previous five-year plan, and targets a 30% lift in transmission capacity.
The equipment engine
China Built the World's Grid Supply Chain, and It Is Deflating Its Own Prices
China's capex did not just consume hardware; it created the capacity to make it. Chinese transformer exports hit a record 64.6 billion yuan ($9.3 billion) in 2025, up nearly 36% year on year, at an average unit price of 205,000 yuan. Because that supply base exists, American import prices for Chinese electrical equipment sit at 93.8 on an index where June 2012 equals 100 — prices now sit below their 2012 base — and they are still sliding, from 94.5 in July 2026 to 93.8 in September.
| Signal | Reading | What it says |
|---|---|---|
| Sieyuan Electric Q3 2026 revenue | ¥6.97B, +30.7% YoY | Volume is running hot |
| Sieyuan Electric Q3 2026 net income | ¥939M, +4.5% YoY | Price and margin are not following |
| Sieyuan Electric gross margin | 30.9%, down from 33.3% a year earlier | The exporter is funding the shortage |
| US import price of Chinese electrical gear | 93.8 in Sep 2026 (Jun 2012 = 100) | Below 2012 levels and still falling |
| TBEA 9M 2026 revenue | ¥85.6B, +17.4% YoY | Chinese capex is a volume story, not a profit story |
The Chinese supply chain behind the global grid
State Grid, 2026-30 programme
¥4.0 trillion ($574B)
Up 40% on the prior five-year plan; transmission capacity target +30%
State Grid grid outlays, 2025
¥639.5B, +5%
China Electricity Council data reported March 2026
NARI Technology, 9M 2026 revenue
¥43.88B, +13.7%
Grid automation and protection; trailing net income ¥8.34B on net cash
TBEA, trailing revenue
¥109.9B
After three flat years near ¥97-98B; trailing net income only ¥4.01B
The policy turn
Then Washington Closed the Factory Door at the Worst Possible Moment
On August 31, 2026, US Executive Order 14420 banned imported bulk-power equipment from China and up to 23 other nations. Wood Mackenzie's assessment was blunt: the order could affect more than $22 billion of imports since 2025, with China representing almost all bulk-power imports since the beginning of 2025. At that moment the market was already short: power transformers were 15% short and substations 8% short, with the 100 MVA segment the most acute and the market above 10 MVA having expanded roughly 300% since 2020.
- The order bans imported bulk-power equipment from China and as many as 24 nations, covering goods worth more than $22 billion in imports since 2025.
- It catches data centres mid-construction: Wood Mackenzie says they had been using Chinese units to minimize lead times, exactly the units the order excludes.
- The scope is not yet defined. The Department of Energy has 120 days to write rules on what counts as bulk power, so the size of the supply cut is not yet known.
- The timing is the damage. Large power transformer lead times averaged 128 weeks in the most recent Wood Mackenzie survey, with generator step-up units running to 144 weeks — five years before a unit arrives.
None of this is physics. Transformers are not a scarce natural resource; they are a manufacturable product with a learning curve. The United States had a 15% shortage of a product China shipped $9.3 billion of in 2025, at an average export price of 205,000 yuan a unit across all sizes. The shortage is a capacity, permitting and tariff outcome, and the executive order widens the policy component rather than the physical one.
Pricing the premium
The Premium Is About 2.5 Cents per kWh — and Here Is the Arithmetic
PJM capacity clearing price by delivery year
Base Residual Auction results. The 2028/29 auction cleared at the administrative cap, and prices in the most constrained zones would have cleared above $775/MW-day had the cap not bound.
Unit: USD per MW-day
2024/25
Pre-AI baseline
28.9
2026/27
More than 11x the baseline
329.2
2027/28
Cleared at the cap; auction 6,831 MW short
333.4
2028/29
138,318 MW procured
325
2028/29 uncapped
Equilibrium where the administrative cap did not bind
775
PJM's capacity market is where the scarcity gets a price, and it has repriced by an order of magnitude. Capacity cleared at $28.92 per MW-day for the 2024/25 delivery year, at $329.17 for 2026/27, at the $333.44 administrative cap for 2027/28 — with that auction 6,831 MW short of its reliability requirement — and at $325 per MW-day for 2028/29. This is not a gradual squeeze; the cap, not the market, has been setting the price for three consecutive delivery years.
Convert that into a per-kilowatt-hour cost and the premium becomes concrete. At $325 per MW-day, one megawatt of firm capacity costs $118,625 a year; at an 85% load factor, or 7,446 MWh, that is $15.93 per MWh, against $1.42 per MWh in 2024/25. The incremental cost is therefore roughly 1.5 cents per kWh at the capped price, and about 3.7 cents had the auction cleared at its uncapped equilibrium above $775 per MW-day. The midpoint of that range sets the US data centre's capacity bill at about 2.5 cents per kWh — before a single dollar of energy-price inflation.
- Capacity is charged per MW-day of firm capacity, so every megawatt-hour a data centre draws carries its share of the $325 price.
- US electricity prices rose 6.9% in 2025, more than double the 2.9% headline inflation rate, and a federal regulator has demanded that technology companies pay their own share.
- In the largest US power region a federal watchdog reported a 76% electricity price spike that it described as irreversible.
- Data centres are now a ballot-box issue in midterm battleground states, which caps how far the premium can travel before regulators intervene on behalf of ratepayers.
Who collects the rent
Western Backlogs, Chinese Volume — and a De-Rating Already Under Way
The scarcity rents are landing in two places: Western equipment backlogs and US power sellers. GE Vernova took $29 billion of orders in the third quarter, up 96% organically, booked $12.6 billion of revenue and lifted backlog to $197 billion, guiding to full-year revenue of $46.5-47.5 billion and free cash flow of $16-17 billion. Siemens Energy is running the same playbook in grids: an order backlog of €162 billion, a 1.57 book-to-bill, and a Grid Technologies segment growing revenue 28.6% at a 19.9% margin.
| Company and period | Backlog | Growth | Margin signal |
|---|---|---|---|
| GE Vernova, Q3 2026 | $197B, up $20B sequentially | Orders $29B, +96% organic | Adjusted EBITDA margin 15.4%, up 690bps organically |
| Siemens Energy, Q3 FY2026 | €162B group; €51B Grid Technologies | Revenue €11.4B, +18.5% comparable | Grid Technologies margin 19.9% before special items |
| Vertiv, Q3 2026 | Not disclosed in the release | Net sales $4.31B, +61% | Adjusted operating margin 25.2%, up 290bps |
| Constellation Energy, trailing to Jun 2026 | Not applicable | Revenue $31.3B | EBITDA $8.0B; 14.1x trailing EV/EBITDA |
| Sieyuan Electric, Q3 2026 | Not disclosed | Revenue +30.7% | Gross margin 30.9%, down 238bps year on year |
Here is the part that should worry the bull case. GE Vernova's market capitalisation fell from $314.9 billion at the end of June 2026 to $204.9 billion by early November: the market has taken 35% off the stock while backlog grew by $20 billion. It now trades on 18.5 times trailing EV/EBITDA and 4.3 times trailing sales, with trailing earnings of $38.45 a share. The market is not disputing the demand. It is pricing the durability of a premium that Washington created and Washington can withdraw.
Downstream, the money keeps moving. Constellation Energy converts scarcity into contracted cash flow — trailing revenue of $31.27 billion, EBITDA of $7.98 billion and net income of $3.47 billion — while Vertiv sells the boxes that make a megawatt usable, with third-quarter net sales up 61% to $4.31 billion, organic orders up more than 100% and adjusted operating margin of 25.2%. With hyperscaler capital spending running at roughly $725 billion in 2026, the downstream buyers of power are not the ones rationed. The upstream Western manufacturers of grid gear are.
| Link in the chain | Named players | Evidence of linkage |
|---|---|---|
| Upstream — equipment supply into the global grid build-out | Sieyuan Electric, TBEA, NARI Technology | Chinese transformer exports hit a record 64.6B yuan in 2025; China's own grid spend reaches ~$140B in 2026 |
| Midstream — Western grid and generation OEMs | GE Vernova, Siemens Energy | Backlogs of $197B and €162B; Grid Technologies running a 19.9% margin |
| Downstream — power sellers and data-centre infrastructure | Constellation Energy, Vertiv | Trailing EBITDA of $8.0B against a $325/MW-day capacity price; Vertiv net sales up 61% |
| End customer — large US hyperscalers | US hyperscaler capex of roughly $725B in 2026 | Roughly twice the entire US national energy investment of $615B |
Horizons
What Moves First, and What Would Break the Thesis
Two clocks matter here, and they are not the same clock. The next four quarters are about converting a policy-made scarcity into cash. The next three years are about whether the policy survives contact with the supply chain.
- Department of Energy rulemaking on the definition of bulk power under Executive Order 14420 lands within 120 days and sets the real size of the supply cut.
- GE Vernova should exit 2026 with backlog above $200 billion and at least 130 GW of gas slot reservations, against $197 billion and 122 GW at the third quarter.
- The next PJM capacity auction, for the 2029/30 delivery year, tests whether the administrative cap still binds and therefore whether the premium is still capacity-constrained.
- State Grid's 2026 programme keeps Chinese grid orders full into year-end even as the American export market closes.
- If the executive order's scope narrows, Chinese units return to American buyers and Western lead times compress within roughly 18 months.
- If it holds and widens to 24 nations, the Western OEM order book becomes a multi-year annuity and capacity bought at $9 billion a deal resets the comparison base.
- Chinese equipment makers keep volume but not price, so their returns track Chinese grid capex rather than the AI cycle and stay hostage to a domestic spending number.
- If hyperscaler capital spending slows from roughly $725 billion, the scarcity premium unwinds faster than the equipment backlog converts, leaving Western OEMs with a long order book and falling prices.
State the falsifiers plainly. If Chinese transformer export unit prices turn up sharply while volumes hold, the market has genuinely cleared and the scarcity argument weakens. If PJM's next auction clears below the cap, the capacity premium has already begun to unwind. And if Chinese domestic grid spending stalls below the $140 billion the IEA expects, the deflation engine that has held equipment prices down stalls with it. None of those three has happened yet.
The thesis
One Country Owns the Scarcity Supply Chain, and the Premium Is the Price of Closing It
Pulling it together. China is spending $945 billion a year, 1.5 times the United States, and rotating that spending into grid hardware, which is why Chinese equipment is the marginal supply in every market and why prices for it sit below 2012 levels. The United States answered a genuine manufacturing bottleneck with tariffs, an executive order banning imported bulk-power equipment, and an administratively capped capacity market that cleared 6,831 MW short. The result is a power premium for US data centres of roughly 1.5 to 3.7 cents per kWh of capacity cost, about 2.5 cents at the midpoint, and a windfall for a narrow set of Western balance sheets. That premium is a policy variable, not a physical one, and it will be repriced by Washington, by PJM, or by the next election long before it is repriced by physics.
China is the largest global energy investor by a wide margin.
Where the capex lands, and who keeps the margin
- Q3 2026 orders of $29 billion, up 96% organically, lifted backlog to $197 billion, and management guides to exiting 2026 above $200 billion and at least 130 GW of gas slot reservations.
- The scarcity premium behind its 15.4% adjusted EBITDA margin rests on an executive order, and Washington can widen or withdraw it.
- Near term the stock is de-rated rather than de-risked: market value fell from $314.9 billion at end-June to $204.9 billion by early November, leaving it on 18.5x trailing EV/EBITDA and 4.3x trailing sales.
- Over one to three years the backlog is a multi-year annuity only if the import ban holds; a narrowed order puts Chinese units back into American tenders.
- Grid Technologies grows revenue 28.6% at a 19.9% margin, with a €51 billion segment backlog, a 1.48 book-to-bill and group backlog of €162 billion at 1.57.
- FY2026 guidance for Grid Technologies of 25-27% revenue growth and an 18-20% margin shows the pricing is being held, not given away.
- Over one to three years the swing factor is identical for every Western OEM: whether the scope of the US import ban holds, because a narrowed order lets cheaper supply back into US tenders.
- Third-quarter net sales rose 61% to $4.31 billion with organic orders up more than 100% and adjusted operating margin of 25.2%, up 290 basis points year on year.
- Full-year 2026 adjusted operating margin guidance was raised to 23.5-24.5%, and trailing revenue reached $13.12 billion with $5.00 billion of gross profit.
- Horizon: Vertiv sells downstream of the grid, so it earns on hyperscaler capital spending of roughly $725 billion in 2026 rather than on grid scarcity, making it less policy-exposed than the equipment makers.
- converts the capacity-price spike into contracted cash flow: trailing revenue of $31.27 billion, EBITDA of $7.98 billion and net income of $3.47 billion.
- At 14.1x trailing EV/EBITDA and 3.6x trailing sales, it is priced for a normal power market rather than for a $325 per MW-day capacity price that clears at the administrative cap.
- Horizon: this is the cleanest expression of the premium and also the most exposed if the next PJM auction clears below the cap or regulators order ratepayer relief.
- grew Q3 revenue 30.7% while net income rose only 4.5%, with gross margin down 238 basis points year on year to 30.9%.
- China's $140 billion grid spend keeps its order book full: nine-month revenue reached ¥17.76 billion, up 28.5%, with trailing revenue of ¥25.48 billion.
- Against that, Executive Order 14420 closes the highest-margin export market for Chinese bulk-power equipment, and US import prices for its gear sit below 2012 levels — volume without pricing power.
- Over one to three years its earnings track Chinese grid capex and the export rule, not the global AI cycle.
- captures China's grid-automation spending at a 25.1% trailing gross margin, on ¥71.53 billion of trailing revenue, ¥8.34 billion of net income and a net cash balance sheet.
- Nine-month revenue of ¥43.88 billion was up 13.7%, and it trades on 18.4x trailing EV/EBITDA and 2.6x trailing sales.
- Horizon: this is a domestic-China play with no American export exposure, so the import ban is irrelevant to it; the risk is Chinese grid spending stalling below the $140 billion the IEA expects.
- added 17.4% to nine-month revenue while attributable profit fell, with Q3 revenue up 18.2% as investment fair-value losses ate the earnings line.
- Trailing revenue of ¥109.9 billion after three years flat near ¥97-98 billion shows how much volume Chinese energy capex has pushed through the system.
- But capital expenditure runs at 22.1% of revenue, free cash flow to the firm is negative ¥12.2 billion, and net debt stands at 5.1x EBITDA — the volume story is financed, not earned.