Macro & Policy
Rates, inflation and the policy that moves them
Central bank decisions, jobs prints and fiscal policy, read the way a portfolio reads them: what reprices, by how much, and what would change the call.
2026-11-04


2026-11-03

19 Midterms, 19 Wins: Election Day 2026 Tests the Record With a Hiking Fed, $104 Oil and Debt-Funded AI Capex
The S&P 500 has been higher 12 months after the October close in all 19 midterms since 1950, averaging 16.6%. That record survived four midterms where the Fed hiked into the vote, but not cheaply: October-to-December returned exactly 0.0% on average across 1978, 1982, 2018 and 2022, against +3.6% for all 19. Election Day 2026 arrives with a Fed that raised rates in September, held on 10-2 with two governors dissenting for another hike, Brent at $104.66, and AI capex that is now 32% debt-funded, so the marginal AI dollar is priced off the same policy rate being raised. The tradable question is not whether the index ends the year higher but who collects the cash: suppliers paid on volume (NVIDIA, TSMC, SK hynix) versus buyers funding a buildout on borrowed money (Alphabet), and producers versus fuel consumers (ExxonMobil, Delta Air Lines).

Bankers Report Business Loan Demand Swung 28 Points Negative as AI Capex Pulls Credit to Nonbanks
On Nov. 2 the Fed's senior loan officers reported that business loan demand weakened for the first time in more than a year: the net share of banks seeing stronger C&I demand swung from +16.1% to -11.7% in one survey round, and banks blamed borrowers walking to more attractive bank or nonbank funding. The money did not disappear — it changed hands, because the same survey shows banks expanding lending to nondepository finance intermediaries and private equity funds while AI-adjacent commitments have grown from 9% to 13% of bank C&I commitments and now run near a quarter of tier-1 capital at large banks. With the Fed on hold at 3.75%–4.00% and markets pricing a 76% chance of a Dec. 8–9 hike, the squeeze on everyone who is not building AI data centers arrives just as the price of money goes up.

The Office Is Full and the Collaboration Is Gone: The New York Fed Survey That Undercuts the Office Recovery
A New York Fed survey of 1,835 college-educated workers, fielded in September 2026, found that 48.8% had no in-person meetings on their most recent day in the office and 70.6% had at least one teammate absent, which means attendance has been restored but the collaboration that offices are priced for has not. Because organizational sprawl, not absenteeism, explains about 48% of the lost face time, employers cannot repair it with mandates, and the landlord data already shows the strain: Hudson Pacific Properties lifted same-store leased occupancy 8.1 points year over year while average rent per square fell to $56.78 from $57.57, while SL Green Realty still shows a $128.3M trailing net loss against roughly 14x net debt to EBITDA. The pain sits upstream in real estate and office services, while commuting-linked demand holds up: Starbucks grew comparable coffeehouse sales 6.2% in Q4 FY2026 and Uber grew revenue 12.2% year over year in Q2 2026. For the December policy debate, the same bank's research argues that soft payrolls are compositional, so the committee should be reading inflation, not headcount.
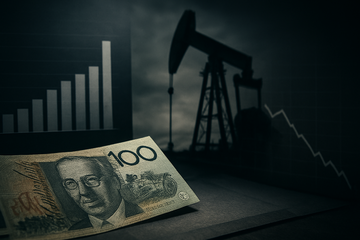
The RBA Hiked to an 18-Year High and the Australian Dollar Fell - That Is the Fed's December Problem
On November 3 the Reserve Bank of Australia raised its cash rate to 4.85%, its highest since November 2008 and its fifth increase of 2026, and the Australian dollar still slipped to 0.6982. That combination - a board that raised its own inflation forecast while hiking, an imported oil shock, and a currency that refuses to rally - reframes the roughly 80%-priced December Fed hike as the middle of a global re-tightening rather than the end of one. The bill lands at the long end: the 10-year term premium is back near 1.0% with the US 10-year at 4.91%, while Washington is already trying to manage the curve and pay over $1 trillion of annual interest. Own the cash flow at the top of the oil chain and the lenders whose margins widen with every hike; be underweight the duration a fiscal-driven hiking cycle breaks.
Treasury's $618 Billion Quarter Is a Cash-Balance Illusion — the Real Borrowing Need Rose $24 Billion
Treasury's November 2 estimate cut fourth-quarter net marketable borrowing to $618 billion, but the entire $10 billion reduction comes from a $34 billion higher opening cash balance; strip it out and the underlying October–December cash-flow need rose $24 billion. The forward calendar is heavier, not lighter: January–March 2027 is now marked at $800 billion against a $1 trillion end-March cash target, while the December 8–9 Fed meeting carries roughly a 71%-priced hike that keeps $7.90 trillion parked in money funds instead of the long end. The investable conclusion is narrow — banks earning higher net interest income and a widening private-credit window are the winners, while the long end stays hostage to a savings pool that AI capex is already absorbing.
2026-11-02

Charles Schwab money-in-motion meets Series I bonds: a 5.51% retail inflation lock shifts the Fed’s cash-and-claims math
Starting Nov. 1, 2026, newly issued Series I savings bonds reset to a 5.51% composite rate (1.40% fixed + 4.08% inflation component) for purchases through Apr. 30, 2027. That creates a new, retail-driven “inflation-yield floor” inside the cash-management channel—potentially pulling brokerage sweep and money-fund flows at the exact moment sticky inflation makes the Fed’s headline problem worst.

A Blue Sweep Buys Oversight, Not Relief: The Tariff Wall Was Rebuilt Under Section 232 Before the Vote
Democratic control of Congress would not repeal a single live tariff: with neither chamber likely to reach a veto-proof majority, the only statutes Democrats can legislate against are Section 338 and the Section 122 surcharge that expired on July 24, 2026, while the wall itself was rebuilt on Section 232, Section 301 and Section 338 after the Supreme Court struck down the IEEPA tariffs on February 20, 2026. The investable variable is therefore administrative, not electoral — which tariffs survive the proclamation flow, and how Canada's $20 billion of 15% to 50% counter-tariffs, live since September 8, 2026, lands in first-quarter 2027 income statements. Inside the protected industries the dispersion is already wide: Nucor widened gross margin to 19.6% in the June 2026 quarter while Cleveland-Cliffs ran a 1.9% trailing gross margin on $20.1 billion of sales and a $473 million net loss.
2026-11-01
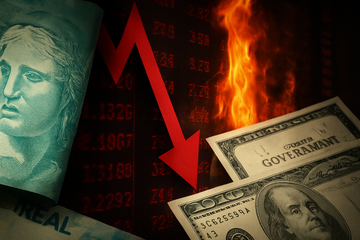
Brazil's One-Day Rout Wiped Out 73% of a Year's EM Carry — and the 4.93% Funding Leg Has Nowhere to Fall
Lula's re-election on Oct 25, 2026 took the Brazilian real down 8.36% in a single session and pushed the 10-year local government bond up 246 basis points to 15.45%, erasing 73% of the 11.45-point spread that dollar-funded investors were paid to hold. The shock was a positioning event, not a solvency event: hard-currency credit barely moved while the currency and local rates absorbed the damage. With the Fed on hold at 3.75–4.00% and the 10-year Treasury at 4.93%, the funding leg of every carry trade is fixed while the currency leg can gap — which is why the most crowded EM carry market is where the unwind shows up first.
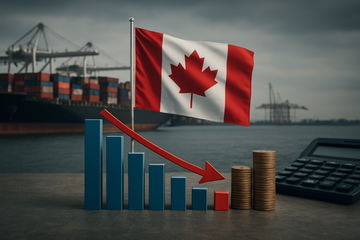
Canada's Flat August GDP Is the Last Clean Read — the 50% Tariffs Only Landed on August 22
Canada's real GDP was flat in August for a second straight month and Statistics Canada's September advance estimate points to a 0.1% decline, leaving third-quarter output up just0.3% on the quarter. That flat print is also the last clean read, because the US 50% tariff lists took effect on August 22 and the fourth quarter is the first period that fully prices a trade war now covering USMCA-compliant goods with no expiry date. Into that, the Bank of Canada raised its policy rate 25 basis points to 2.50% on October 28 to stop energy-driven inflation from spreading — and the cheap-heavy-crude windfall that comes with it lands in Valero Energy and Phillips 66, not in Canada's GDP.

India's Coal Burn Is Back at a Three-Year High — and Almost None of It Is Imported Coal
India's coal-fired generation rose 13.3% year on year in September 2026 and the power deficit hit 560 million kWh, the largest since August 2023, yet the coal was domestic: the government is cutting power-sector thermal coal imports by at least 15 Mt this year while national output heads for a record 1,095 Mt. That matters for the sovereign-compute build-out, because the 26.3 GW of data-centre load India has projected for 2031-32 will be served by coal plants running on three days of fuel and by gas at a tripled $33/MMBtu benchmark, not by clean firm power. The money sits in power equipment, turbines, cooling and compute — not in the seaborne coal trade the headlines imply.

Korea's $115 Billion October Was Already Contracted: The AI Selloff Is Pricing Funding, Customs Is Pricing Shipments
Korea's October trade data, published Sunday, showed exports up 93.7% to $115.28 billion with semiconductor exports up 259.4% to $56.44 billion — half of everything the country ships — and a $42.50 billion surplus, two days after the AI cash-burn selloff took the Nasdaq down 2.86% and SK hynix down 7.1%. The two facts are compatible: the selloff repriced the financing of AI capital spending, while customs data records money already spent on memory that has already shipped. Most of the export growth was price rather than volume, so the honest signal is the level — $115 billion a month, $930 billion in ten months — not the growth rate. And the demand behind it is largely pre-sold and pre-funded: more than 50% of SK hynix's 2027–28 capacity is already under long-term agreement, and Micron holds $32 billion of customer cash deposits. The real risk is not a demand collapse but concentration: semiconductors are now half of Korean exports, and the buyers are funding themselves with debt.
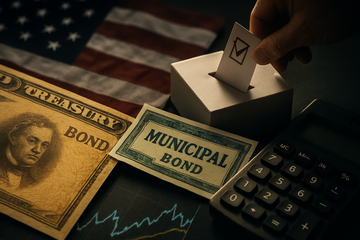
Too Tight to Tighten: Muni Spreads at 76bp Can't Carry Nov. 3, So the Vote Lands on Tax Rates and a $84 Billion Supply Wave
Municipal credit spreads cannot carry the Nov. 3 election: BBB munis ended September at 76bp and high yield at 143bp, both inside their five-year averages, so there is no spread cushion left for a vote to work on. What the election reprices is the tax arithmetic and the supply calendar — California's wealth and income-tax measures raise what tax-exempt income is worth to blue-state buyers, Florida's $150,000-to-$250,000 homestead exemption shifts local tax burden, and at least $84 billion of voter-approved bonds land in 2027 on top of a $473.8 billion nine-month issuance pace. The tradeable edges are narrower than they look: Assured Guaranty is the one listed guarantor whose premiums are compounding with that supply, while the leveraged municipal funds, where an 8.49% distribution becomes a 12.5% taxable equivalent for a 32% taxpayer, are levered to a 4.98% 10-year rather than to the ballot.

The SNB's CHF 19.1 Billion Quarter Was Mostly a Weak Franc — and October Reversed CHF 10 Billion of Its Gold Gain
The Swiss National Bank's 30 October print of CHF 19.07 billion was 61% currency translation and 39% gold revaluation, and the gold leg has already given back about CHF 10 billion as spot gold fell to $3,880.97 and USD/CHF reached 0.8212 — leaving the nine-month gold contribution near CHF 1.2 billion, not CHF 19 billion. The binding constraint on monetising official gold is the size of the tap, not the size of the gain: distributions to the Confederation and cantons are capped at CHF 6 billion a year, the federal budget assumes CHF 4 billion in 2026, and the rest sits in a CHF 12.9 billion reserve. That makes repatriation the wrong frame, because the marginal buyer of gold in 2026 is now the ETF complex, which took $11.7 billion of Q3 inflows while central banks bought just 170 tonnes through August. The tradeable consequences sit one layer down the chain: Newmont's realised-price reset, CME Group's volatility toll, and Chow Tai Fook Jewellery Group's ticket-price relief.
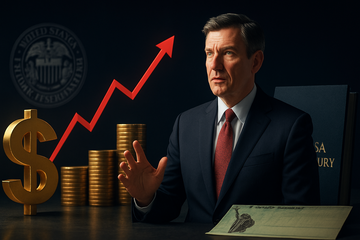
Bessent Blesses the Hike While Treasury Buys Back the Long End: The Curve, Not the Rate, Is the Trade
Treasury Secretary Scott Bessent's Oct. 28 comment that further Fed hikes would be \"not necessarily\" a policy mistake, followed by St. Louis Fed President Alberto Musalem's Oct. 30 call for additional firming \"and soon,\" puts the executive branch behind a December rate increase. The real change is not the 25 basis points but the division of labor it creates: the Fed raises the front end to defend 2% inflation while Treasury, running a $1.99 trillion deficit with more than $1 trillion of interest outlays, buys back 10- to 30-year paper to cap the long end. That pairing steepens the curve on purpose — lifting bank net interest income while raising the discount rate and the coupon on an AI buildout being financed with $300 billion to $570 billion of new debt.
2026-10-31
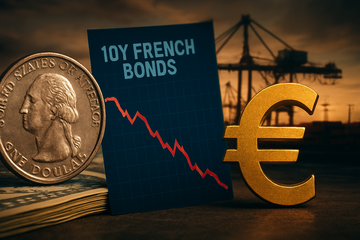
The Dollar Shrugged Off a 3.4% Print: Europe's Growth Gap Is Being Priced in French Bonds
The euro area grew 0.4% in the third quarter — twice the 0.2% economists expected — while the U.S. printed 3.4%, and yet the dollar index fell 0.23% on the day both numbers landed. That is the tell: this divergence is not being priced in currencies, it is being priced in French sovereign risk, where the 10-year gap over Germany is the widest since the euro-zone crisis and where the ECB's own stability review warns that tighter credit is testing corporate debt-servicing capacity. Europe now carries higher inflation than America (3.8% against 3.7%) on a fraction of the growth, which is why the ECB is hiking into a 0.4% quarter while the Fed sits still. The investable consequence is narrow and specific: the same energy shock that constrains both central banks is lifting upstream and AI-linked earnings, while a euro at $1.118 turns European revenue into a translation and volume drag for U.S. companies.

Gold Fell3.6% While Treasuries Bought the Bid: October 30 Was a Funding Squeeze, Not a Safe-Haven Moment
Gold closed at $3,875.84 on Oct. 30, a one-year low, and silver broke $50 for the first time since November 2025 — on the same session the 10-year Treasury yield fell to 4.94% from 5.05% three days earlier. That combination is the signature of a funding squeeze, not a change in the inflation view: Commerzbank called the drop exaggerated and pointed to margin calls, while the safe-haven bid landed in duration and in the corporate credit the AI buildout keeps printing. The consequence for equities is arithmetic. Newmont realized $4,317/oz in Q3 against an Oct. 30 close of $3,875.84, and at $1,520/oz of costs its $2,863/oz margin becomes roughly $2,356. Downstream users of the metals won: First Solar expanded gross margin to 57.9% from 38.3% a year earlier, and Chow Tai Fook Jewellery guided first-half profit up about 90-100% as cheaper gold cut input costs.
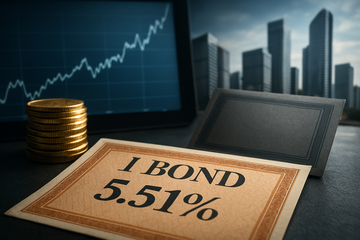
I-Bonds at 5.51% Just Raised the Household's Risk-Free Bar — and the AI Buildout Answered With $228 Billion of Bonds
Treasury's Oct. 30, 2026 announcement set the Series I composite rate at 5.51% for purchases from Nov. 1, 2026 through Apr. 30, 2027 — a 1.40% rate locked in real terms for two decades plus a CPI adjustment, with no mark-to-market and no state or local tax on the interest. That guarantee now sits above the trailing cash yield of most of the AI capital-spending chain: Microsoft, Alphabet, Amazon and Meta Platforms turned $615 billion of trailing capex into $61 billion of trailing free cash flow. The buildout did not slow; it changed sponsors, with Alphabet, Amazon, Meta Platforms and Oracle issuing more than $228 billion of bonds through Oct. 13 — so the marginal risk in the AI trade now sits in credit priced off a 4.98% risk-free rate, not in household equity demand.

New York Halved Its Budget Gap on Wall Street Money — and Its Tax Base Is Now Levered to the AI Trade
New York's Division of the Budget used a record Wall Street year to project roughly $9 billion of surplus for the fiscal year ending March 2027 and cut the state's three-year General Fund gap from $31.7 billion to $17.6 billion. The receipts behind that swing are concentrated: the securities industry generated an estimated $26.3 billion of New York State tax in State Fiscal Year 2025-26, 20.8% of all state tax collections and 88.3% of it personal income tax funded by bonuses and realized gains. That makes the state's balance sheet a derivative of the same equity cycle that pays Wall Street, and the New York City Comptroller's own scenarios show the downside arriving as a $3.4 billion city revenue hit in a single year. Read the update as a cyclical windfall being banked, not a structural fix: the gap re-widens to $8.9 billion by fiscal 2030, and the listed exposure runs from Goldman Sachs and Morgan Stanley through the volume tolls at Intercontinental Exchange and Nasdaq to M&T Bank and SL Green Realty.
Wages Grew at Their Slowest Pace in Five Years. Benefits Grew Faster.
The Q3 employment cost index, released October 30, shows private-sector compensation up 3.4% over the year, but the composition flipped: wages and salaries added 3.1% while benefit costs added 3.9%, the second consecutive quarter in which benefits outran pay. The engine is employer health insurance, up 6.4% over the year, with single-coverage premiums rising 8.5% and family premiums 7.6% — the largest increases since 2010. That complicates the December hike rather than confirming it, because the Fed's own September minutes show the hawkish case resting on tariffs, energy and AI-linked goods rather than wages. It also reshapes where margin relief lands: Walmart's US operating expenses deleveraged 72 basis points on healthcare and claims costs, HCA Healthcare held salaries and benefits to 43.2% of revenue, and Delta Air Lines saw salaries rise 9% against a 3.1% national wage print.
What to expect
Evidence-first notes with a visible point of view.
This section collects sharp takes on earnings, shareholder meetings, and market structure. Each new piece should make the thesis, the facts, and the implications obvious within the first few screens.
Expect direct analysis, not generic commentary.
Expect the data to be explicit and the argument to be easy to follow.